
The Gold
Debasement Model
Gold outperforms cash from every anchor date. The $35 price was never a market price. The 99.1% figure is arithmetically correct and analytically meaningless. The investment case for gold survives. The debasement interpretation does not.
“Since the end of the gold standard in 1971, the U.S. dollar has lost approximately 99.1% of its value relative to gold. In 1971, gold was pegged at $35 per troy ounce, whereas gold trades around $4,550 per ounce.”
The claim arrived as a direct response to Tiaan Fourie’s repost of Lab Case 006. Schoeman Rudman argued that the USD debasement narrative — which Lab 006 had partially undermined on BIS Real EER grounds — was vindicated by gold’s performance since the Nixon shock. The claim is specific, the number is large, and it is repeated across financial social media with such frequency that its forensic problems have been normalised into received wisdom.
The Lab tested five conditions. The investigation also carries a structural Finding 6 — the Eurodollar context — which attacks the causal architecture of the claim rather than its arithmetic. The arithmetic of the 99.1% figure is broadly correct. Every other element of the claim fails forensic scrutiny.
Four anchors.
Primary data. No editorial selection.
The investigation tests gold’s performance against interest-bearing USD cash across four anchor dates — the claim’s own anchor (Jan 1971), the first legally investable date for US citizens (Jan 1975), the originator’s own comparison anchor (Jan 1980), and a neutral modern era start (Jan 2000). Each comparison runs gold price appreciation against the same dollars compounded at the 3-Month Treasury Bill rate — the risk-free rate a dollar holder would actually have earned.
Monthly average USD/oz
Jan 1915 – May 2026 · 1,337 observations
London Bullion Market basis
FRED GOLDAMGBD228NLBM removed Jan 2022
(IBA licensing — source note in methodology)
3-Month Treasury Bill Secondary Market Rate
Monthly · Jan 1934 – Apr 2026
1,108 observations
Compounded monthly throughout each period
This is what a dollar holder actually earned
CPI All Urban Consumers
Monthly · Jan 1947 – Apr 2026
952 observations · Seasonally adjusted
Used to compute real (purchasing-power)
returns for both gold and cash
Jan 1975 — First legal US gold ownership
Jan 1980 — Originator’s own comparison
Jan 2000 — Neutral modern era
All run to March 2026 — latest month all series share
Gold wins.
The interpretation still fails.
The claim’s anchor
Corrected from Schoeman’s data
Jan 2000 → Mar 2026
operational since
| Anchor | Gold start | Gold nominal | Cash nominal | Gold real | Cash real | Winner |
|---|---|---|---|---|---|---|
| Jan 1971 — Peg anchor | $38.00 | +12,190% | +1,028% | +1,385% | +36% | Gold |
| Jan 1975 — Legal ownership | $176.25 | +2,550% | +794% | +320% | +42% | Gold |
| Jan 1980 — Schoeman’s anchor | $668.00 (avg) | +599% | +542% | +65% | +52% | Gold (narrow) |
| Jan 2000 — Neutral modern era | $283.05 | +1,550% | +64% | +746% | −16% | Gold (dominant) |
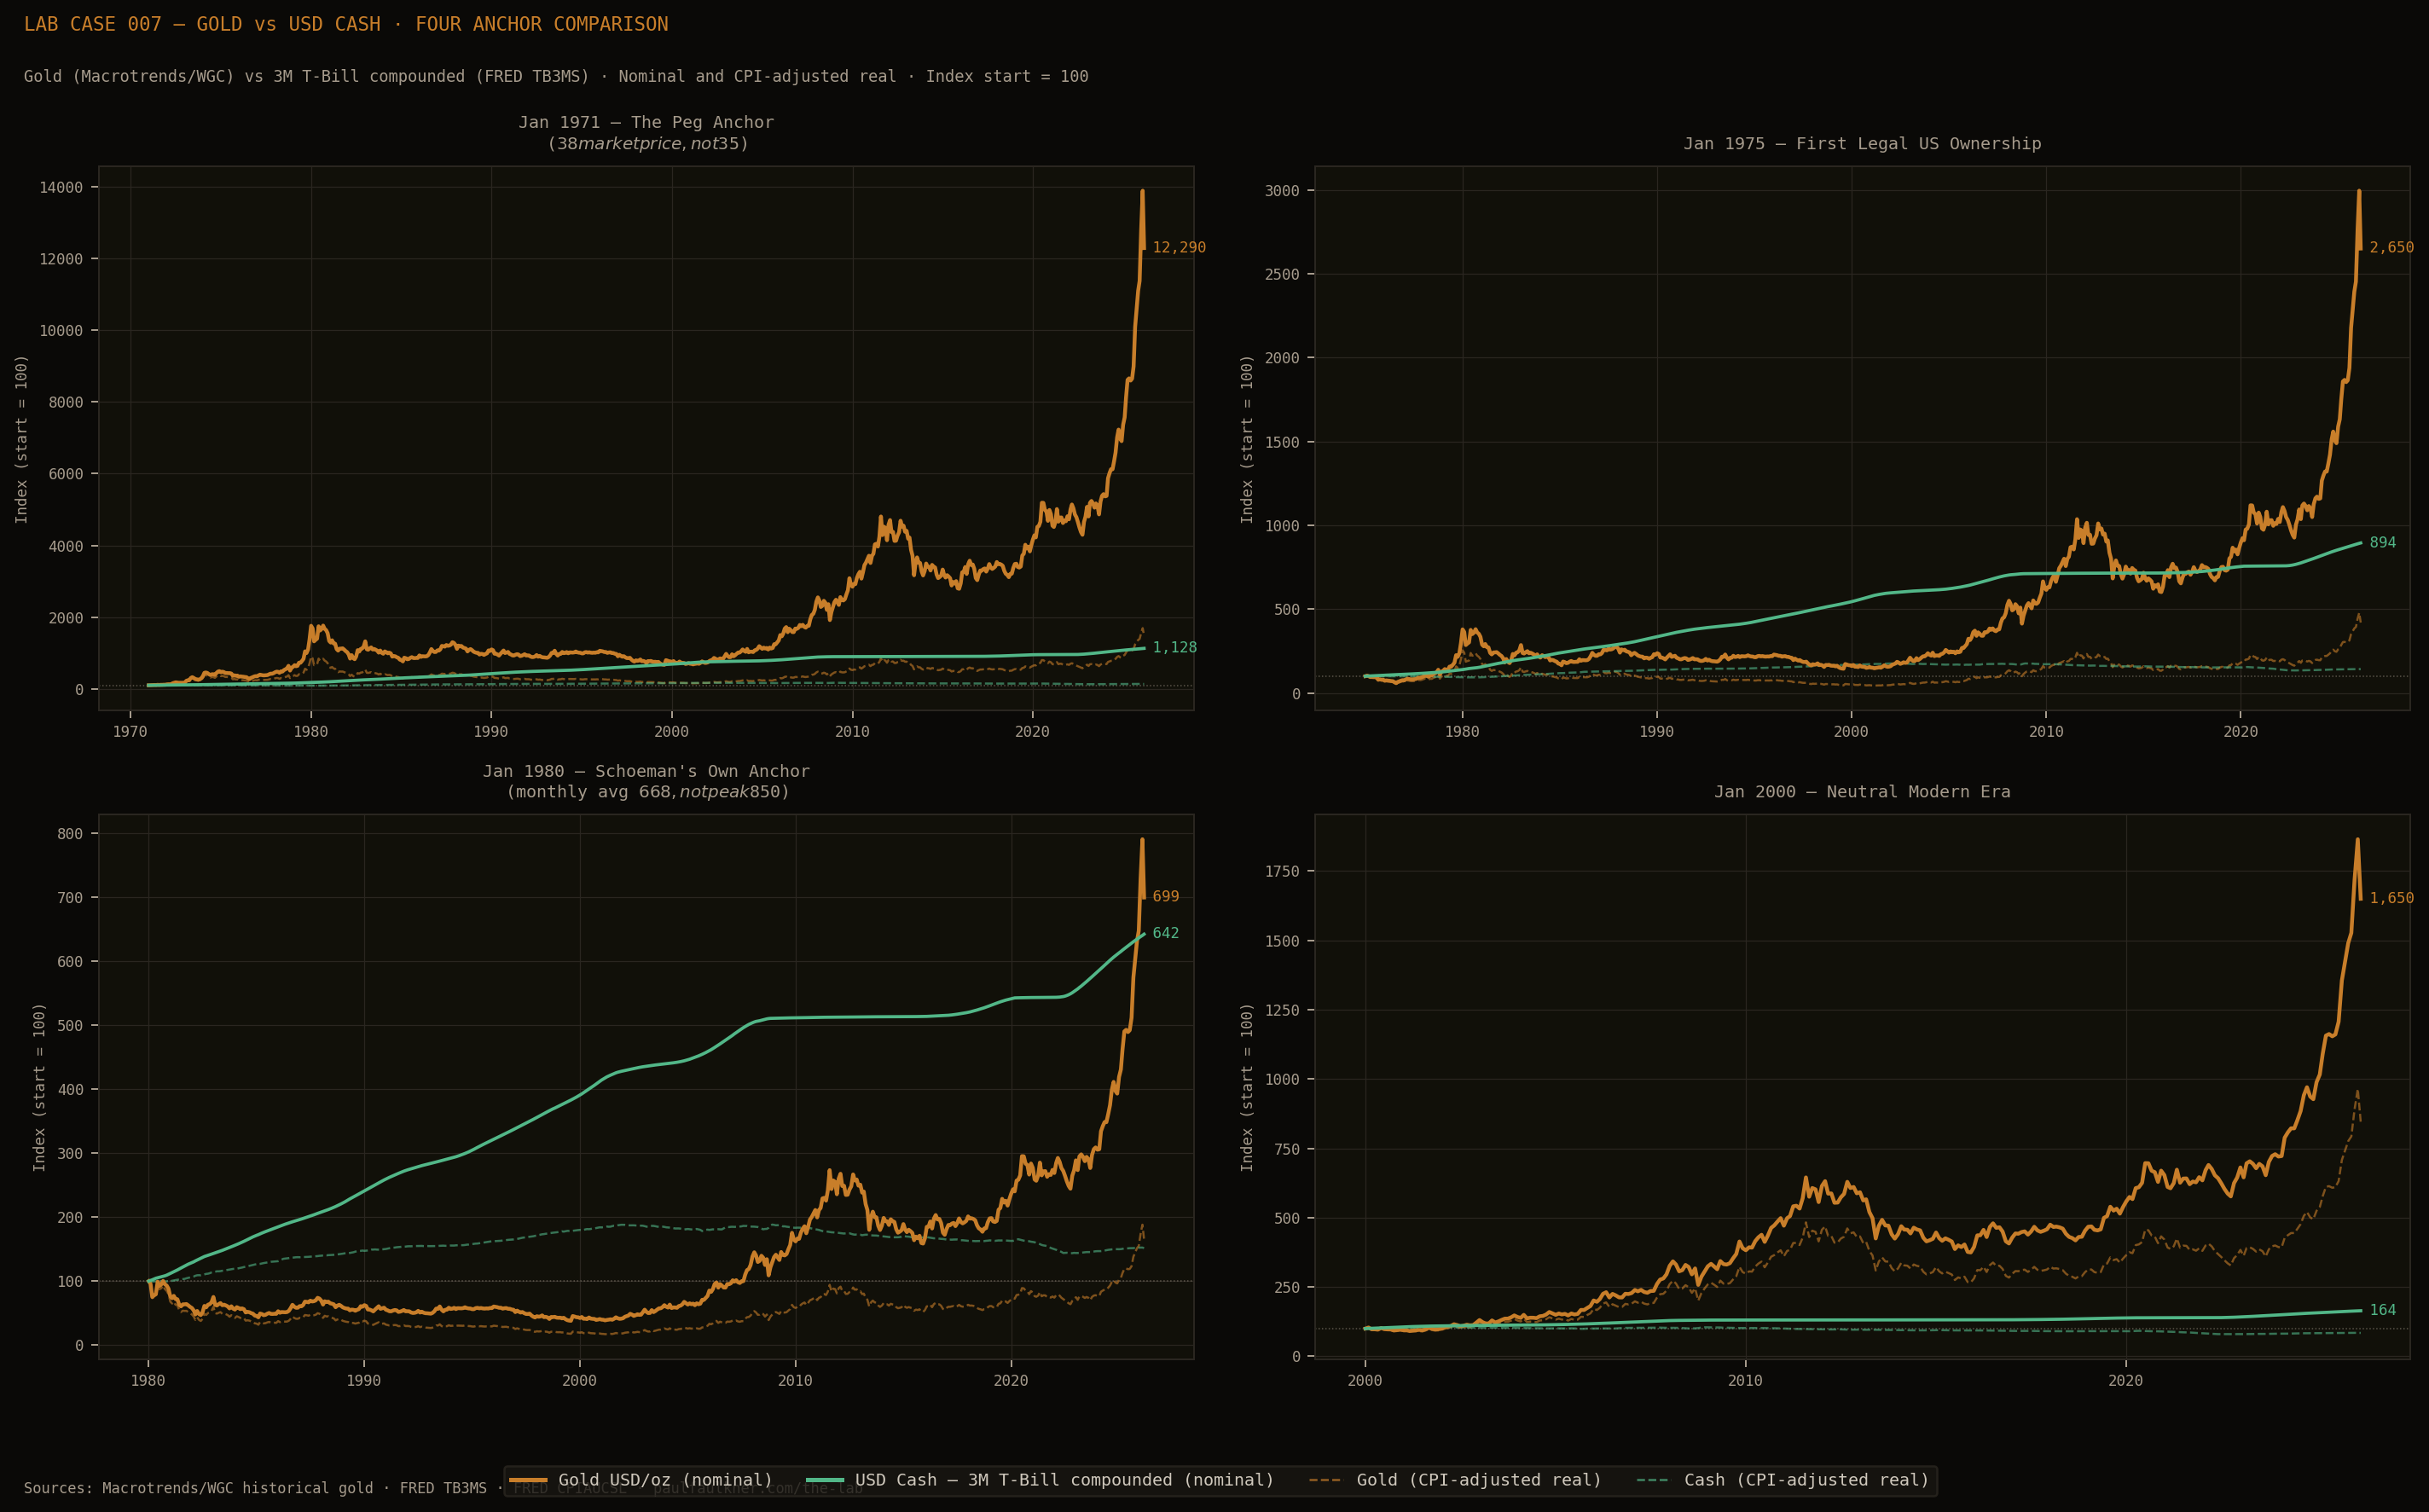
The finding that gold outperforms interest-bearing cash from every anchor date is the investigation’s most important result — and it cuts against the debasement narrative rather than supporting it. If the dollar were being systematically debased, gold’s real return should be approximately zero. A currency hedge stores value; it does not compound it. Gold’s real return from 2000 of +746% is not a debasement signal. It is a commodity appreciation signal driven by industrial demand, central bank accumulation, and dollar-cycle dynamics.
The distinction matters. Schoeman’s claim is that gold performance demonstrates dollar failure. The data shows gold performance demonstrates gold appreciation — a different claim entirely, with a different set of drivers, none of which require the dollar to be “failing.”
The number is right.
Everything else fails.
From the first traded price of $38.00, the loss is 99.2% — essentially the same number. The partial verdict reflects that the arithmetic survives but the anchor does not. The $35 figure is not wrong; it is a price that never existed as an investable entry point.
The claim that “the dollar has lost 99.1% of its value relative to gold since 1971” requires a 1971 entry point. No such entry point was available to the retail or institutional investor the claim is addressing. The debasement argument is measuring the distance between a controlled price and a free market price fifty years later. That is price discovery, not monetary erosion.
The condition fails not because cash beats gold — it doesn’t — but because gold outperforming cash is not evidence of debasement. By the same logic, NVIDIA outperforming cash since 1993 would constitute evidence of dollar debasement. The comparator was chosen because gold is the asset the narrative requires, not because it is the correct measure of monetary erosion. The correct measure — CPI, or the BIS Real EER tested in Lab Case 006 — was documented in the previous investigation.
Gold’s January 1980 monthly average price (Macrotrends/WGC) was $668.00. Schoeman’s figures are consistent with using the $850 intraday peak — the single most expensive entry point in the entire 1980 gold spike. Starting from the monthly average, gold returns +599% vs cash +542% — gold wins, narrowly. Starting from the $850 peak, cash wins. Schoeman chose the peak to manufacture a result his own corrected data does not support.
The irony is precise: he accused the debasement narrative of cherry-picking start dates, then cherry-picked the start price within the same month.
This condition passes. The investigation’s findings are analytical, not reputational. A sincerely held claim that fails on the data fails on the data regardless of the originator’s motives.
The Eurodollar market — operational by 1957 — demolishes this architecture. Soviet bloc countries held USD reserves in European banks, primarily Banque Commerciale pour l’Europe du Nord in Paris (cable address: EUROBANK), deliberately placing them outside Federal Reserve jurisdiction to avoid US government seizure under Cold War sanctions risk. British clearing banks recognised they could intermediate these dollar deposits outside Regulation Q interest rate caps and Federal Reserve reserve requirements. By the late 1950s, the City of London had constructed a parallel dollar monetary system that operated entirely outside US monetary control.
The system Nixon “broke” in 1971 was already bifurcated fourteen years earlier. The dollar’s international monetary role was already operating outside the Bretton Woods framework — before the gold window closed, before the debasement anchor date, before the $35 peg became the $38 market price. The causal claim requires a unified monetary system that a sovereign decision fractured. The historical record shows a system that was already structurally divided by the market-driven emergence of offshore dollar intermediation.
This is not a data-testable finding. It is a structural one. The Eurodollar context does not change the gold return figures. It removes the explanatory framework that makes those figures a debasement argument rather than an asset appreciation argument.
Lab 005 was M2.
Lab 006 was nominal EER.
Lab 007 is gold.
Lab Case 005 documented Gerhard Kuschnik dividing the S&P 500 by M2 and presenting the compressed result as evidence that equity returns are “essentially monetary debasement.” Lab Case 006 found that the BIS Real EER from January 1973 to March 2026 shows +0.12% — the inflation adjustment eliminated the nominal debasement claim entirely. Lab Case 007 presents the third variant of the same analytical move: divide the dollar’s value by gold and present the 99.1% compression as debasement evidence.
Each case uses a different denominator. Each denominator was chosen because it produces a large negative number. Each large negative number is then presented as evidence of systematic monetary failure. The methodology is identical across all three. The denominator changes. The move does not.
The distinction Lab 007 adds is that gold actually is a better long-run store of value than cash — the investment argument for gold survives the forensic examination. What does not survive is the debasement interpretation: the claim that gold outperforming cash constitutes evidence of dollar failure rather than evidence of gold appreciation driven by industrial demand, geopolitical demand, and central bank accumulation dynamics that have nothing to do with US monetary policy failure.
Tiaan Fourie — whose Lab Case 006 engagement prompted this investigation — is, by his own description, “a massive fan of gold and its application in global portfolios to improve risk-adjusted performance.” That is a coherent and defensible investment position supported by the data in this investigation. Gold has outperformed cash in real terms from every anchor tested. It belongs in a diversified portfolio as a volatility hedge and non-correlated asset.
None of that requires the debasement narrative to be true. Gold can be a good investment for good reasons that have nothing to do with the dollar failing. The debasement framing is not necessary for the investment case — and when it is deployed, it requires the analytical moves documented across Lab Cases 005, 006, and 007: choose the denominator, pick the anchor, present the dramatic number, omit the methodology.
Jan 1915 – May 2026 · 1,337 obs
London Bullion Market basis
WGC consolidated: Bloomberg,
Datastream, ICE BA, MCX India
Note: FRED GOLDAMGBD228NLBM
removed Jan 2022 (IBA licensing)
Secondary Market Rate
Monthly · Jan 1934 – Apr 2026
1,108 observations
Federal Reserve Bank of St. Louis
Compounded monthly per period
Monthly · Jan 1947 – Apr 2026
952 observations
Seasonally adjusted
Federal Reserve Bank of St. Louis
Used for real return deflation
Partial.
Gold wins. The interpretation doesn’t.
The 99.1% figure is arithmetically defensible. Gold has outperformed interest-bearing cash from every anchor date tested, in both nominal and real terms. These findings are real. They do not constitute evidence of monetary debasement.
The $35 anchor was a government-enforced fixed price, not a market price. The first freely traded month was January 1971 at $38. Gold ownership was illegal for US citizens until January 1975, by which time gold already traded at $176 — five times the peg price. Schoeman’s own 1980 comparison used the intraday peak price rather than the monthly average; corrected data shows gold winning that comparison too, but not by the margin his chart suggested.
The structural finding — Finding 6 — is the investigation’s most significant contribution. The Eurodollar market, operational since 1957, demonstrates that the singular monetary break point the debasement narrative requires never existed. The dollar’s international monetary role was already operating outside Bretton Woods constraints fourteen years before Nixon closed the gold window. The causal architecture fails before the data is examined.
Gold is a legitimate portfolio asset with a documented long-run real return that outperforms cash. The investment case survives. The debasement interpretation — that gold’s performance demonstrates dollar failure — does not require the investment case to be true, and is not supported by it.