
The USD
Debasement Model
The nominal case for dollar weakness holds. The real case does not. From 1973 to 2026, the inflation-adjusted dollar moved +0.12%. That is not debasement. That is monetary stability dressed in nominal clothes.
“The US dollar has been systematically debased over the long run. Nominal USD weakness — measured against currency baskets and purchasing power — demonstrates structural monetary erosion. When adjusted for interest rates and PPP, the picture changes substantially. Always trust the math not the magicians. Always adjust for the measuring stick.”

The claim emerged from Lab Case 005, in which Gerhard Kuschnik’s assertion that S&P 500 returns were “essentially monetary debasement” was disproved in under 30 minutes. Tiaan Fourie — Founder of Responsible Capital — identified the same analytical problem in USD debasement narratives: that nominal weakness looks dramatic, but interest-rate adjustment and PPP anchoring materially change the picture. The Lab agreed the question deserved the same forensic treatment.
This is a different class of investigation from Lab Cases 001–005. The originator is not being tested adversarially. The framing is substantive, the methodology concern is legitimate, and the thesis is falsifiable. The question is whether the adjusted picture confirms, qualifies, or eliminates the debasement claim. The data answers it directly.
Three series.
62 years. All primary.
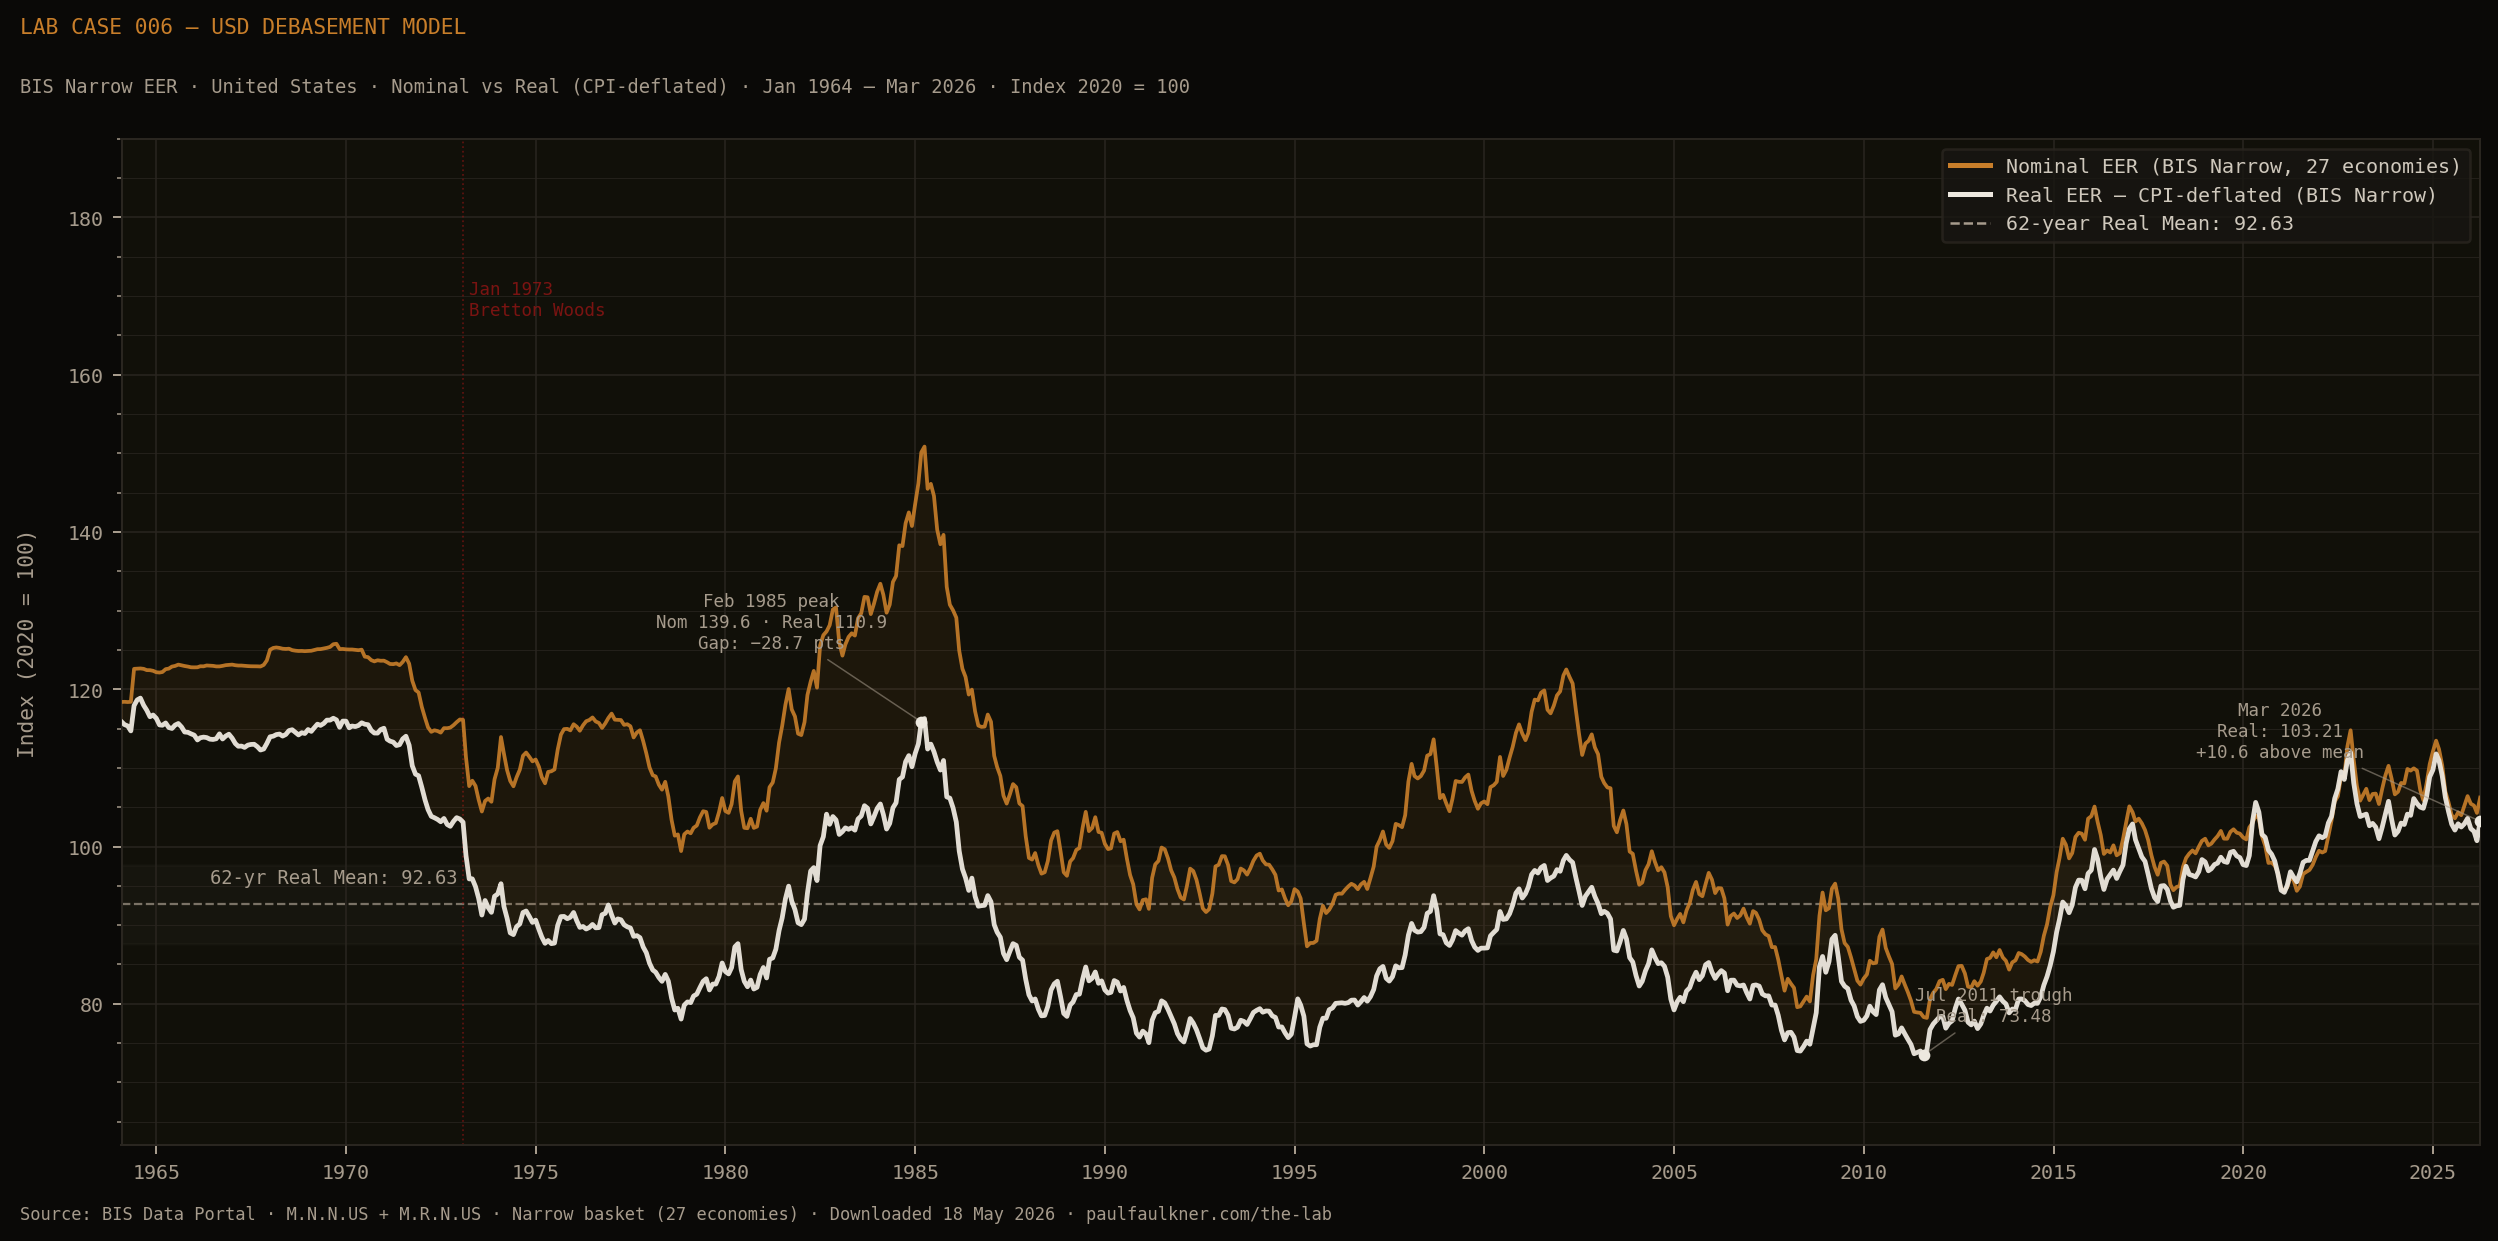
The investigation uses three source series, all from authoritative primary sources. The FRED nominal series (DTWEXBGS and its discontinued predecessor DTWEXM) provides daily data back to January 1973 on a broad trade-weighted basis. The BIS Narrow EER dataset — downloaded directly from the BIS Data Portal on 18 May 2026 — provides both nominal and real effective exchange rates monthly from January 1964, with the real series CPI-deflated. The BIS real series is the correct instrument for testing whether nominal weakness persists after inflation adjustment.
Jan 2006 – May 2026 · 5,310 observations
Index, Jan 2006 = 100
DTWEXM (discontinued) back-extended via splice
Jan 1973 – Dec 2019 · 12,261 observations
Scale factor: 1.1789 (mean ratio over 3,514-day overlap)
Splice stdev: 0.0040 — negligible drift
27 economies · Monthly averages · 2020 = 100
Jan 1964 – Mar 2026 · 747 observations
Two series: Nominal (M.N.N.US) + Real (M.R.N.US)
Real series is CPI-deflated — adjusts for relative inflation differentials between the US and trading partners. This is the correct instrument for Conditions 2 and 3.
What 62 years
actually shows.
Jan 1973 → Mar 2026
Jan 1973 → Mar 2026
March 2026
September 1985 Peak
| Reference Point | Nominal EER | Real EER | Spread (R−N) | % Divergence |
|---|---|---|---|---|
| Jan 1964 (series start) | 118.38 | 115.87 | −2.51 | −2.12% |
| Jan 1973 (Bretton Woods breakdown) | 116.11 | 103.09 | −13.02 | −11.21% |
| Sep 1985 (post-Plaza Accord) | 139.63 | 110.94 | −28.69 | −20.55% |
| Mar 2008 (GFC onset) | 79.57 | 74.05 | −5.52 | −6.94% |
| Jul 2011 (cycle trough) | 78.31 | 73.48 | −4.83 | −6.17% |
| Sep 2022 (Truss/Ukraine peak) | 112.73 | 110.94 | −1.79 | −1.59% |
| Mar 2026 (latest) | 106.22 | 103.21 | −3.01 | −2.83% |
| Period | Average Real EER | vs Long-run Mean | Direction |
|---|---|---|---|
| 1964–1973 | 111.41 | +18.78 above | Elevated |
| 1974–1985 | 93.19 | +0.56 above | Near mean |
| 1986–2000 | 83.06 | −9.57 below | Below mean — trough era |
| 2001–2010 | 84.85 | −7.78 below | Below mean |
| 2011–2020 | 89.67 | −2.96 below | Recovering |
| 2021–Mar 2026 | 103.41 | +10.78 above | Elevated — three consecutive rising periods |
| Mar 2026 (current) | 103.21 | +10.58 above mean | Above long-run mean |
The decade averages tell the structural story the debasement narrative requires but cannot find. The real EER troughed in the 1986–2000 period — averaging 83.06, nearly 10 points below the long-run mean. Since then it has risen in every successive period: 84.85, then 89.67, then 103.41. The dollar in real terms has appreciated for three consecutive decades. A thesis of structural erosion requires a consistently downward trajectory. The data shows a trough followed by sustained recovery.
The current reading of 103.21 sits 10.58 points above the 62-year historical mean of 92.63. If the dollar were in structural debasement, it would be below its historical mean, not above it. The adjustment that Tiaan’s framing correctly identified as necessary is the same adjustment that ultimately undermines the debasement claim in its strong form.
Nominal holds.
Real does not.
The pass carries a qualifying note on magnitude. −7.2% (broad spliced) to −8.5% (BIS Narrow) across 53 years is approximately −0.15% per annum. This is nominal weakness on the record. It is not the dramatic structural erosion the term “debasement” implies.
This is the core forensic finding. The condition tests Tiaan’s own hypothesis — that adjustment methodology matters. It does. But the conclusion the adjustment produces is that 53 years of apparent nominal weakness disappears entirely in real terms. The adjustment does not produce a corrected debasement number. It produces near-zero.
From January 1964, the divergence is only −0.66pp (Nominal −10.27%, Real −10.93%), which would pass. But 1964 predates the Bretton Woods breakdown. It is not the correct anchor for a free-float debasement thesis.
The condition’s fail criterion is explicit: if the real EER is currently above its long-run historical mean, the movement is cyclical rather than structural. The current reading of 103.21 sits 10.58 points above the 62-year mean of 92.63. The fail criterion is met.
The trough era (1986–2000, average 83.06) is the period from which a debasement narrative is most easily constructed. It is also the period that ended 25 years ago. The dollar’s real purchasing power has been recovering since, and is currently at historically elevated levels — the opposite of the structural erosion the thesis requires.
The caveat is material and should not be buried. Starting from March 2008 — the dollar’s cycle trough near the GFC — nominal returns to March 2026 are +33.49% and real returns are +39.38%. The prescribed start dates all predate the 2008 trough. Any post-trough anchor produces the opposite conclusion. The condition is narrowly passed as written, but the underlying claim of start-date independence is fragile: it holds for pre-trough anchors and fails for post-trough anchors. That is, by definition, a cyclical pattern — and a finding that reinforces Condition 3’s verdict.
Directional note from the data: The choice to present nominal rather than real returns, and to anchor at 1973 rather than 2008, is analytically material and directionally favourable to a debasement thesis. Neither choice is dishonest, but both require explicit disclosure when presenting the argument publicly. The Lab’s methodology applies this equally to all originators. Tiaan’s own framing — “always adjust for the measuring stick” — is precisely the standard that, when applied consistently, produces the finding recorded here.
The adjustment that
was right to ask for.
Lab Case 005 documented a specific manipulation: Gerhard Kuschnik divided the S&P 500 by M2 and presented the result as evidence that equity returns are “essentially monetary debasement.” The trick worked because dividing any long-run return series by any large growing number compresses it. The denominator was chosen because it produced the desired number.
Tiaan Fourie’s comment — that the same trick applies to USD debasement narratives, that nominal weakness looks dramatic but adjustment changes the picture substantially — was the correct analytical observation. The Lab agreed and opened the investigation on that basis.
The finding is therefore more precise than a simple pass or fail. Tiaan was right that the adjustment matters. The data confirms it matters profoundly. The adjustment gap at the 1985 peak was 28.69 index points — the Volcker nominal dollar strength was substantially an inflation illusion, exactly as the thesis anticipated. But the full application of “always adjust for the measuring stick” does not produce a corrected debasement number. It produces +0.12% over 53 years, and a current real EER 10.58 points above its long-run mean.
The measuring stick, applied consistently, removes the debasement as well as the illusion.
The 1985 episode is the most instructive. At the nominal peak in February 1985, the dollar had reached 176.64 on the spliced broad index — a level that appeared to represent extraordinary dollar strength. The BIS Real EER at that point was 110.94. The 28.69-point gap between nominal and real was not dollar strength. It was the Volcker disinflation making US inflation lower than trading partners’, temporarily inflating the nominal measure beyond its real purchasing power content.
The same logic applies in reverse to the debasement case. Nominal weakness that is explained by the US having higher inflation than its trading partners is not debasement in any meaningful economic sense — it is the measuring stick doing what it is supposed to do: adjusting for different rates of monetary erosion across economies. When you apply that adjustment over the full period, the 53-year aggregate nominal weakness of −8.52% contracts to +0.12%.
That is not a small methodological correction. It is the entire finding.
Series: M.N.N.US + M.R.N.US
Narrow basket · 27 economies
Monthly · Jan 1964 – Mar 2026
747 observations · Downloaded 18 May 2026
Index 2020 = 100
DTWEXBGS · Jan 2006 – May 2026 · 5,310 obs
DTWEXM (discontinued) · Jan 1973 – Dec 2019
Back-extended via DTWEXAFEGS splice
Scale factor: 1.1789 · Splice stdev: 0.0040
Index Jan 2006 = 100
Founder, Responsible Capital
LinkedIn · May 2026
Responding to Lab Case 005
Gerhard Kuschnik / S&P Debasement Model
Constructive engagement · No commercial agenda identified
Partial.
Nominal holds. Real does not.
The debasement thesis survives as a nominal statement. The dollar is lower in trade-weighted nominal terms today than in 1964, 1973, 1985, or 2002, and this weakness is sustained rather than episodic. That is a legitimate finding. It is also the full extent of what the data supports.
Two conditions fail. The critical finding is at the 1973 anchor: the BIS Real EER records +0.12% change from January 1973 to March 2026 — essentially zero. The inflation adjustment eliminates the entire apparent nominal weakness. Additionally, the current real EER of 103.21 sits 10.58 points above its 62-year historical mean of 92.63, with three consecutive decades of real appreciation since 2001. This is not structural erosion. It is a dollar that is, in real purchasing-power terms, at historically elevated levels.
The thesis as stated — that nominal weakness demonstrates structural monetary erosion, and that adjustment for interest rates and PPP changes the picture substantially — is correct in its methodological observation and incorrect in its implied conclusion. The adjustment does change the picture substantially. It changes it from −8.52% to +0.12%. That is not a corrected debasement argument. That is the debasement argument’s refutation.
This investigation followed a different engagement model from Lab Cases 001–005. Tiaan Fourie identified the thesis analytically, not promotionally, and the framing correctly anticipated that adjustment methodology would be the central forensic question. The Lab agreed and opened the investigation accordingly.
The originator was not contacted prior to publication. The data is unambiguous and requires no originator input to resolve. Tiaan Fourie is invited to respond to the findings via thelab@paulfaulkner.com. Any substantive response — including challenge to the choice of anchor date, basket, or adjustment methodology — will be published in full and linked from this page.
This is The Lab’s first investigation to return a Partial verdict. The standard applies consistently: the data produces the finding, not the prior relationship with the originator.