
7 93 Model

Chai 7/93 Model · Forensic Validator | The Rogue Protocol
Risk Warning · For Information Only
This tool is for educational and informational purposes only and does not constitute financial advice. The Rogue Protocol is not authorised by the FCA. Crypto assets are high risk. Past data may not reflect future outcomes. Data is sourced from public APIs and may contain inaccuracies or lag.
Chai 7/93 Model · Forensic Validator · The Rogue Protocol

Raymond Chai built a
falsifiable thesis.
This is the test.

Raymond Chai proposed that 93% of on-chain economic activity flows through stablecoins — and he defined five specific conditions under which he would be wrong. This tool holds those conditions to live data. No predetermined verdict. No narrative. The investigation is open, the methodology is visible, and the finding — whatever it is — gets documented.

Why This Investigation Exists

Raymond Chai put a thesis into the public record. When Paul Faulkner asked for the model behind the number, Raymond built the derivation live — in the comments, in real time, unprompted.

That intellectual honesty is the reason this is Lab Case 001. The Lab only investigates theses whose originators are willing to be named and willing to engage with a test. Raymond meets both conditions. The investigation is collaborative by design — he has seen the methodology, he is invited to challenge the test design, and any error he identifies gets corrected and credited.

This tool does not exist to destroy the thesis or to validate it. It exists to find out what the data actually says — and to document that finding transparently, whatever it turns out to be. The data decides. Not the narrative.

The Core Claim — Verbatim
“Stablecoins currently dominate on-chain economic activity (80-90% of volume), and this dominance will persist over the next 3-5 years, with Bitcoin’s share of daily transaction volume not returning to 50% or above.”
Model Author Raymond Chai
Model Anchor Date 3 May 2026
Prediction Window 3–5 Years
Conditions to Falsify 5 (any one sufficient)
Current Day
Live — CoinGecko
Live — DeFiLlama
Simulated — On-chain DAA
Manual — Merchant volumes
Manual — Survey data
Fetching data…

If any one of these triggers, the model fails

Raymond defined the conditions himself. We test them as stated. Conditions 1, 2, and 5 update automatically from live APIs. Conditions 3 and 4 require quarterly manual input and are flagged accordingly.

Loading condition data…
Fetching verdict…
Awaiting live data
The conditions are being evaluated against current on-chain data. This will take a moment.
Initialising data pipeline…

The headline number does not survive its own maths

This is a neutral forensic audit of the derivation Raymond provided in the LinkedIn thread. We are not arguing he is wrong about stablecoin dominance — we are auditing whether the 7% figure is internally consistent with the calculation steps he gave.

Raymond’s Derivation — Step By Step
How he got to 7%
Raymond provided this chain of reasoning in the LinkedIn thread of 3 May 2026. We reproduce it verbatim, then audit the arithmetic.
STEP 1 — HOW MANY PEOPLE HOLD MEANINGFUL BITCOIN?
Rich list addresses with ≥1 BTC ≈ ~825,000 (addresses, not people)
With ≥10 BTC ≈ 130,000
With ≥100 BTC ≈ 18,000
Combined just under 1M addresses hold ≥1 BTC

STEP 2 — GLOBAL FINANCIAL SYSTEM
Global population ≈ 8.2B
Adults with financial access ≈ 5.5B
Active digital payment users ≈ 1–2B

STEP 3 — THE 7% CALCULATION
Monthly active crypto users ≈ 300–500M
On-chain stablecoin volume ≈ 80–90%
∴ Bitcoin-primarily users = 10% × 400M = 40M

40M ÷ 8.2B global population = 0.5%
40M ÷ 5.5B adults with access = 0.7%
40M ÷ 1.5B digital payment users = 2.7%
40M ÷ 400M crypto users = 10.0%

Raymond’s stated headline: ≈ 7%
Finding: No step in Raymond’s own derivation produces 7%. The arithmetic gives 0.5%, 0.7%, 2.7%, or 10% depending on the denominator. The 7 is the complement of 93 — a residual from the volume claim, not an independently derived user count. Raymond himself acknowledged: “The 7/93 is a framing device.”
What The Rich List Actually Proves
Wealth concentration ≠ usage share
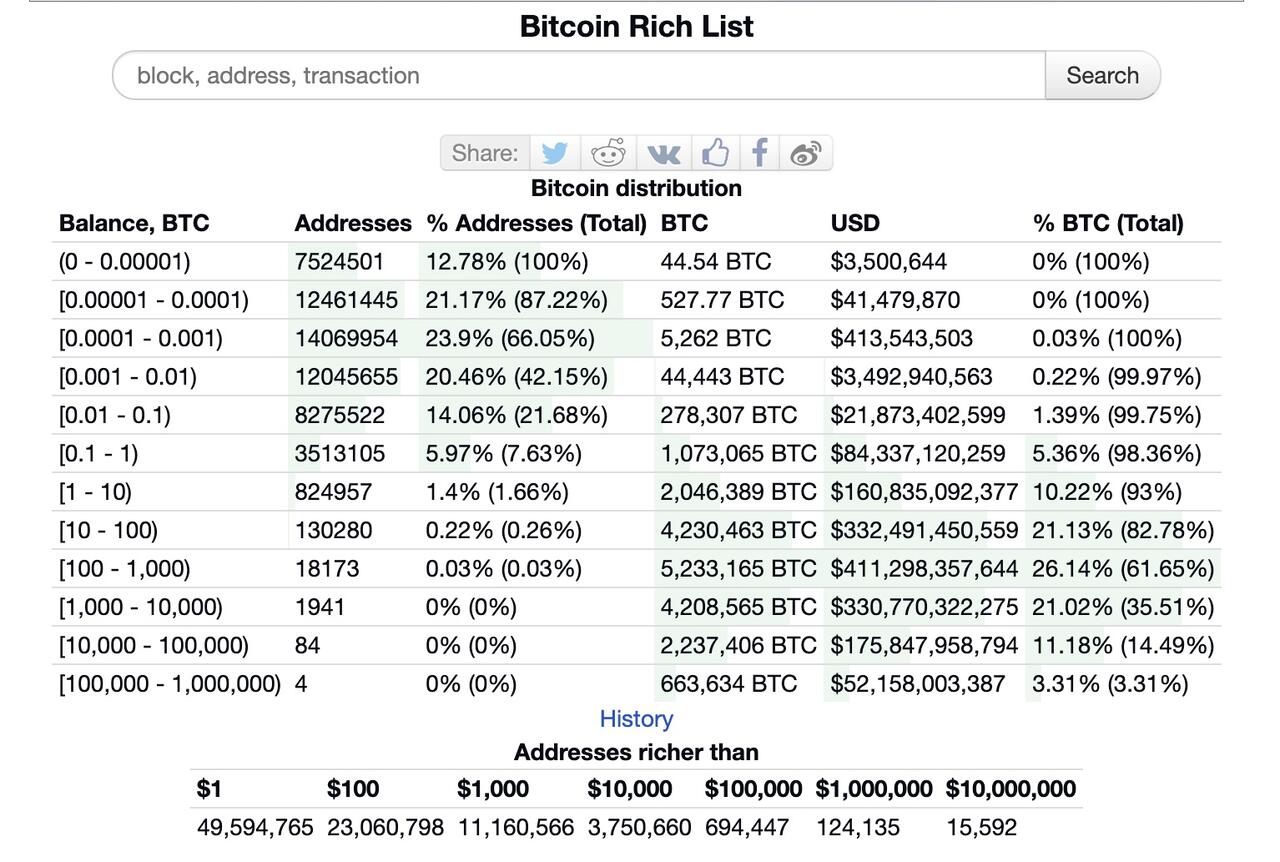
Raymond cited the Bitcoin rich list (the image Paul shared) as evidence for the first claim. But the rich list measures address balance concentration, not usage behaviour. These are different things.
Exhibit A · Source Data Cited By Raymond Chai
Bitcoin Rich List — BitInfoCharts, May 2026
Bitcoin distribution by address balance · BitInfoCharts · May 2026
~825k addresses hold ≥1 BTC · ~130k hold ≥10 BTC · ~18k hold ≥100 BTC · 4 addresses hold ≥100,000 BTC
Note: addresses ≠ people. Exchanges, ETF custodians, and custodial wallets aggregate millions of users behind single addresses.
RICH LIST DATA (MAY 2026)
Addresses with ≥1 BTC: ~824,957
Addresses with ≥10 BTC: ~130,280
Addresses with ≥100 BTC: ~18,173
Addresses with ≥1,000 BTC: ~1,941
Total addresses with any BTC: ~49.6M

WHAT THIS PROVES
BTC is highly concentrated ✓
Most addresses hold dust/small amounts ✓

WHAT THIS DOES NOT PROVE
How many people use Bitcoin primarily ✗
What % of users transact vs hold ✗
ETF/custodial holders don’t appear here ✗
One exchange (Coinbase, Binance) can hold millions of users behind a handful of addresses. ETF custodians hold hundreds of thousands of BTC in single addresses. The rich list systematically undercounts entities in the custodial era. Raymond is right that concentration is high — but that doesn’t tell us what fraction of the 400M crypto users primarily transact in Bitcoin.
Finding: The rich list data supports the store-of-value narrative (concentration in few hands), but cannot be used to derive a user-count figure. The 40M estimate comes entirely from a volume-share proxy (10% of active users), which itself assumes volume share and user share are equivalent — they are not.
What the builder himself flags as missing

To his credit, Raymond flagged two significant weaknesses unprompted. These are not our criticisms — they are his own:

  • Gap 01
    Wash trading and genuine vs exchange-related volume. “I don’t have a good way to measure genuine economic activity vs exchange-related wash trading. Both Artemis and TokenTerminal try to filter out noise, but it’s imperfect.” This caveat is potentially model-busting: if 40–60% of stablecoin volume is circular bot traffic, the genuine ratio could look materially different.
  • Gap 02
    Regulatory discontinuity risk. “The model assumes current regulatory trends continue. A global ban on unhosted stablecoin wallets or mandated on-chain KYC could change everything.” This is a fat-tail risk not captured in the five falsifiable conditions, which are all volume/usage metrics.
  • Gap 03
    The 7% figure is self-described as a framing device. Raymond confirmed: “The 7/93 is a framing device for a real phenomenon.” This is intellectually honest but means the headline number should not be treated as a derived measurement. This tool tests the conditions, not the headline ratio.
  • Gap 04
    Bitcoin’s L1 settlement value is excluded from the denominator. The model counts stablecoin transaction volume on Ethereum/Solana/Tron/BNB, but Bitcoin’s base-layer settlement of large OTC trades, ETF creations, and corporate treasury moves runs to tens of billions daily. If included, the economic value ratio shifts materially.

The concept holds. The number doesn’t.

This is the investigative finding as of 3 May 2026 — Day 0 of the observation window. It will be updated as conditions are tested over time.

Finding 01 · Holds
The concept is well-supported

Stablecoins have won the medium-of-exchange competition. On Ethereum, Solana, Tron, and BNB Chain, stablecoins represent 80–90% of daily transaction volume on any given day. This is consistent across multiple independent data sources and is not seriously contested.

The behavioural claim — that the market has chosen stablecoins for daily economic activity and Bitcoin for store of value — is observable in the data. Raymond’s five falsifiable conditions have not been triggered. The dominance he described is real.

Finding 02 · Does Not Hold
The 7% figure is not a measurement

Raymond’s own derivation produces 0.5%, 0.7%, 2.7%, or 10% depending on the denominator chosen. None of those is 7. The figure is the arithmetic complement of 93 — a residual from the volume claim, not an independently derived user count.

Raymond acknowledged this directly: “the 7/93 is a framing device.” That is intellectually honest. But it means the headline ratio cannot be cited as a measured fact. It is a label for a real phenomenon, not a derived figure.

Finding 03 · Unresolved
The economic value question is open

The model measures transaction count and volume — but Bitcoin’s economic footprint includes large-value settlement on L1 that is structurally different from stablecoin payment flows. Bitcoin’s market cap dominance sits at ~40–50% of all crypto. That is not consistent with a claim of 7% economic relevance.

The unresolved question is: what is the right definition of “on-chain economic value”? Transaction count? Settlement value? Market cap? Each gives a different answer, and the model has not specified which one it intends to measure. This remains open.

Investigative Summary · Paul Faulkner · The Rogue Protocol
Raymond Chai identified a real and significant structural shift in how value moves on-chain. The thesis deserves to be taken seriously. The specific ratio does not.

If you are building an argument on top of this model, build it on the concept — stablecoin dominance of payment and DeFi volume is real, persistent, and growing — not on the 7% headline, which is a framing device that Raymond himself does not claim to have derived. The five falsifiable conditions are the load-bearing structure of the model. They are well-formed. None have triggered.

The Lab will update this conclusion as the observation window progresses. This is a living investigation, not a closed verdict. If Raymond challenges any finding in this analysis, that response will be published here in full.

Lab Case 001 · Opened 3 May 2026 · Originator: Raymond Chai · Status: Active · Next review: Rolling monthly · Contact: thelab@paulfaulkner.com

Where the numbers come from

We are explicit about data quality, update frequency, and assumptions. This tool will never claim a number is live when it is simulated.

Data Pipeline

Sources and update cadence

Metric Source Status
BTC market cap dominance CoinGecko /global Live
Stablecoin tx volume (daily) DeFiLlama /stablecoins Live
BTC on-chain volume share CoinGecko volume proxy Simulated
Daily active addresses — BTC CoinMetrics (proxy) Simulated
USDT+USDC combined DAA Etherscan + Tronscan Simulated
Merchant payment volume BitPay / Chainalysis reports Manual — Quarterly
User survey — BTC primary Binance Research / a16z Manual — Annual
Simulated data: Where live on-chain DAA and volume split data is not yet integrated, this tool uses calibrated simulated values that represent plausible ranges based on published research. These are clearly marked. Full multi-chain integration is in progress.
Design Decisions

What we chose and why

Volume definition. “On-chain transaction volume” means transfer volume on Ethereum, Solana, Tron, and BNB Chain — the chains where stablecoin activity is concentrated. Bitcoin’s L1 is included in market cap dominance (Condition 5) but is structurally different from the L2 stablecoin chains and is treated separately throughout.

Wash trading. We display raw volume by default. The model uses an adjusted figure that attempts to remove known CEX hot-wallet recycling. Raymond conceded this is imperfect. We surface both where data permits, and flag when we cannot separate them.

Consecutive-month counting. Conditions 1, 2, and 5 require thresholds to hold for 3 consecutive months. We track the current streak and display days elapsed toward each threshold. A single month reversal resets the streak counter.

Model anchor. The observation window starts 3 May 2026 — the date Raymond formalised the falsifiable conditions in the LinkedIn thread. Time-window presets calculate from this date.

Agnostic position: This tool neither advocates for nor against the Chai model. If the model holds, it says so. If conditions trigger, it says so. The data decides. Not the narrative.