Educational Content Only · This page does not constitute financial advice, a personal recommendation, or an inducement to trade · Leveraged trading carries a high level of risk · You may lose some or all of your capital
Forensic Education · The Rogue Protocol

The lecture comes from people
who have never run a position.

There is a category of person who will tell you leverage is irresponsible without being able to write down the liquidation formula. They are not managing risk. They are performing an opinion about it.

The same person is typically long spot in a bull market, holding a volatile asset that has historically corrected 80% or more, with no defined exit, no stated downside threshold, and no model for when their thesis is wrong. They are swimming naked and praying the tide stays in. This is not risk management. It is risk that has not been named.

At $90,000 BTC with 3× leverage, your margin is $30,000. The market moves $30,000 against you and your position is liquidated — a 33.3% adverse move.

The market moves $30,000 in your direction and you have returned 100% on your deployed capital — also 33.3%.

The spot holder watching a 33.3% drawdown from $90k has lost $29,970 with no defined floor, no liquidation, and no model. They are still holding the bag at $60k waiting for recovery. That is not the safer position. That is the unquantified one.

This page covers the arithmetic. Not the opinion. Not the recommendation. The mathematics of what leverage actually does — and what the people lecturing about it cannot show you on paper.

What this page is

A worked example. $90,000 entry. 3× leverage. Every number derived, not asserted.

The leverage table. Every common multiplier. Liquidation distance. Recovery requirement.

An interactive calculator. Your parameters. Your liquidation price. Your actual risk.

What this page is not. Financial advice. A recommendation to trade. An endorsement of leverage. The FCA disclaimer is at the bottom. Read it.

Three equations.
That is the entire subject.

Most people who trade with leverage cannot write these down. If you can, you already know more than the majority of participants in the market.

01
Do this first. Every time.
1 ÷ Leverage
= % move that wipes you out
= % move that returns 100% on your money
The same number. Both directions.
What this means
Divide 1 by your leverage number before you do anything else.

The answer — as a percentage — is the exact price move that either ends your position or doubles your money.

At 3×:  1 ÷ 3 = 33.3%
At 10×: 1 ÷ 10 = 10%
At 20×: 1 ÷ 20 = 5%
02
Turn the % into a price
Entry Price × Formula 01
= $ distance to liquidation
= $ distance to 100% gain
Same distance. Both directions.
What this means
Multiply your entry price by the answer from Formula 01.

That dollar amount is how far the price can move — in either direction — before your position is fully resolved.

At $90,000 × 33.3% = $30,000
Liquidation: $90k − $30k = $60,000
Full gain:   $90k + $30k = $120,000
03
Any move, any leverage
Move % × Leverage
= your gain on margin
= your loss on margin
Direction determines which one.
What this means
For any price move, multiply the percentage by your leverage. That is what happens to your capital.

5% move × 3× = 15% gain or loss on margin
5% move × 10× = 50% gain or loss on margin
10% move × 3× = 30% gain or loss on margin

The formula does not care which way you think it is going.
33.3%
At 3× leverage — this is the only number that matters
The market moves 33.3% against you — position closed, margin gone.
The market moves 33.3% for you — margin returned plus another 100%.
Formula 01:  1 ÷ 3 = 0.333 = 33.3%   |   Formula 02:  $90,000 × 33.3% = $30,000 corridor   |   Formula 03:  5% × 3× = 15% on your margin

Stop loss. Take profit.
Formula 02, applied twice.

You have already calculated the corridor. The stop loss and take profit are just orders placed at the numbers you already have. Most people skip this step. That is not a trading decision — it is the absence of one.

Stop Loss
The price you set to exit
before the exchange forces you out.
Formula 02 gave you the liquidation price. Your stop loss sits between your entry and that level — the distance is your decision, not the market's. You are choosing to exit on your terms before the position is closed on the exchange's terms.

At 3× on $90,000 BTC, liquidation is at $60,000. A stop loss at $65,000 means you exit with a defined loss of $25,000 rather than waiting for the full $30,000 margin wipe. You decided. The exchange did not.
The point
A stop loss without a calculated liquidation price is a guess. Formula 02 tells you the floor. Your stop is a level above it. If you cannot write both numbers down before you open the position, you are not managing risk — you are hoping.
Liquidation (from Formula 02)
$60,000
Stop loss (your choice, above liq)
$65,000 example
Take Profit
The price you set to lock in a gain
before the position runs back against you.
Formula 02 gave you the 100% return price. Your take profit can sit anywhere between your entry and that level — that decision is your thesis, not the mathematics. But it must be set before the position is open, not while you are watching a screen and feeling confident.

At 3× on $90,000 BTC, a 33.3% move takes the price to $120,000 and returns 100% on your margin. A take profit at $110,000 locks in a gain of $20,000 — 66.7% on margin — and closes the position before it can reverse.
The point
Most people do not set a take profit. They intend to. When the position is green they feel certain it will go further. This is not a trading strategy — it is emotion with a brokerage account. The take profit is the decision made when you were thinking clearly, not when you were watching a number go up.
100% return price (from Formula 02)
$120,000
Take profit (your choice, below target)
$110,000 example
What most people miss — including people who should know better
The stop loss and take profit are not separate decisions. They are the same calculation — Formula 02 — applied in two directions. You did the maths. You already have both numbers. You are just placing orders at them.
Opening a leveraged position without a stop loss and take profit already set is not bold trading. It is the admission that you did not finish the calculation. The corridor exists whether you place the orders or not. The only question is whether you are the one who decides when the position closes — or whether the market decides for you.

Set both before you click. Not after. Not while the candle is moving. Before.

Spot is not safe.
It is unquantified.

The Spot Holder's Position
Swimming naked, praying the tide stays in.

The spot buyer at $90,000 has unlimited downside to zero with no defined exit. In four prior cycles, Bitcoin has corrected 77%, 83%, 73%, and 65% from its peak. A repeat of the median correction from $90,000 would take the price to $20,000.

There is no liquidation at 33%. There is no mechanism that enforces capital discipline. The spot holder simply holds — all the way through a drawdown that a leveraged trader would have exited at their liquidation threshold. They call this being safe. It is being undisciplined.

The claim that spot holding avoids leverage risk is precisely backwards. The spot holder carries the volatility of the underlying — the same volatility — and adds infinite duration to the position. They are not less exposed. They are exposed without a time limit on how long they can be wrong.

−77%
Max prior cycle drawdown
$0
Defined floor for spot holder
The Leveraged Trader's Position
Defined risk. Known liquidation. No ambiguity.

The leveraged trader at 3× on $90,000 BTC has deployed $30,000 in margin. Their maximum loss is $30,000. The liquidation price is calculable before the position is opened. There is no scenario in which the losses are undefined.

This does not make leverage appropriate for all participants. It makes leverage a tool with quantifiable parameters — which is precisely what a risk framework requires. What you can measure, you can manage. What you refuse to measure, you cannot.

The leveraged trader who loses their margin loses $30,000. The spot holder who held through the 2022 bear market from peak saw an 80% drawdown with no floor, no defined exit, and no model for when they were wrong. The arithmetic is not on the side of the lecturer.

$30k
Maximum loss at 3× on $90k
33.3%
Move to liquidation — defined

$90,000 entry. 3× leverage.
Every number, derived.

The following is a simplified illustration using round numbers. It excludes exchange funding rates, trading fees, and maintenance margin requirements — which in practice narrow the buffers shown below. Those variables are real and material. The purpose of this example is to establish the mechanical framework before those variables are layered in.

The core arithmetic does not change. Only the precision of the numbers does.

Entry Price $90,000
Leverage
Margin Deployed $30,000
Notional Position $90,000
Asset BTC
Price corridor — long position at 3× leverage
$60,000
Liquidation
← −$30,000 | −33.3%
$90,000
Entry
$120,000
+100% ROI
+$30,000 | +33.3% →
← Move 33.3% against you → Margin wiped. Position closed. Entry $90k · Margin $30k · 3× Leverage ← Move 33.3% for you → $30k profit. +100% on margin.
Long Position
Long
Entry price $90,000
Leverage
Notional position size $90,000
Margin required (1 ÷ 3) $30,000
Liquidation price $60,000
Move to liquidation −$30,000  /  −33.3%
Price for 100% return on margin $120,000
Move required (same distance) +$30,000  /  +33.3%
Return on margin at target +100%
Liq = Entry × (1 − 1/Leverage)
Liq = $90,000 × (1 − 0.333)
Liq = $90,000 × 0.667 = $60,000
Short Position
Short
Entry price $90,000
Leverage
Notional position size $90,000
Margin required (1 ÷ 3) $30,000
Liquidation price $120,000
Move to liquidation +$30,000  /  +33.3%
Price for 100% return on margin $60,000
Move required (same distance) −$30,000  /  −33.3%
Return on margin at target +100%
Liq = Entry × (1 + 1/Leverage)
Liq = $90,000 × (1 + 0.333)
Liq = $90,000 × 1.333 = $120,000
The Insight Nobody Writes Down
At 3× leverage, the distance to liquidation and the distance to doubling your money are identical.
Thirty-three point three percent in either direction from $90,000 produces two entirely different outcomes. One terminates the position. One returns your full margin. The market does not know which outcome you want — it simply moves. Risk management at this level is not about avoiding leverage. It is about understanding the corridor and having a reason for the direction.
The Arithmetic Verdict
Every leverage lecturer believes they are managing risk.
Most have never calculated the move that ends their spot position.
They hold Bitcoin. Bitcoin corrects 80%. The position carries no defined floor.
The leveraged trader carries a defined maximum loss. The spot holder carries an undefined one.
Only one of these positions has been modelled. Only one of these people knows their number. The person who calculated it is not the one delivering the lecture.

Every multiplier.
Every liquidation distance.

Based on $90,000 entry price. Simplified: excludes maintenance margin, funding rates, and fees. Real liquidation thresholds will be tighter. Use these as floors, not ceilings.

Leverage Margin ($90k notional) Long liq price Short liq price Move to liq 33.3% move return 10% move return
$90,000 $0 100% +33.3% +10%
$45,000 $45,000 $135,000 50.0% +66.7% +20%
$30,000 $60,000 $120,000 33.3% +100% +30%
$18,000 $72,000 $108,000 20.0% +166.5% +50%
10× $9,000 $81,000 $99,000 10.0% +333% +100%
20× $4,500 $85,500 $94,500 5.0% +666% +200%
50× $1,800 $88,200 $91,800 2.0%
100× $900 $89,100 $90,900 1.0%
Highlighted row (3×) is the worked example above.  Liq formula: Long = Entry × (1 − 1/Lev)  |  Short = Entry × (1 + 1/Lev). Return formula: Move% × Leverage. 50× and 100× returns for a 33.3% move are excluded — at those multipliers, any move beyond the liq distance is academic. Real-world exchange maintenance margins, funding rates, and fees reduce all figures. The mathematics are the floor.

500× leverage exists.
Formula 01 tells you exactly what that means.

The table above stops at 100×. The exchanges do not.
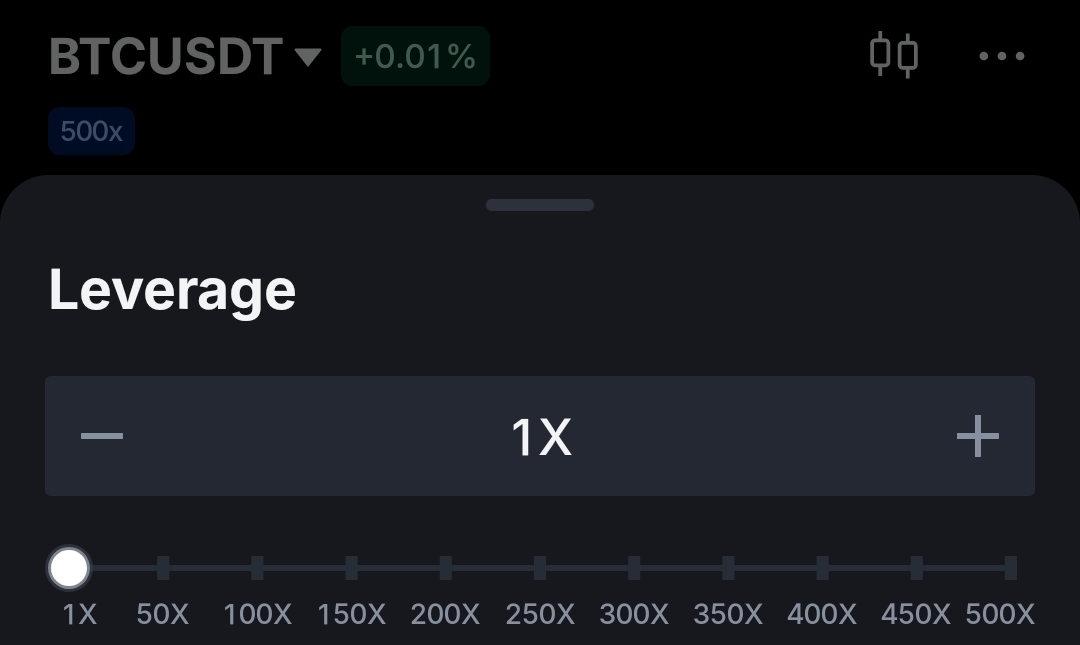
MEXC exchange showing 500x leverage available on BTCUSDT
Formula 01 applied to 500×
1 ÷ 500
= 0.2%
A 0.2% move wipes the position.
$90,000 × 0.2% = $180 — that is your entire corridor.
$180 in either direction. On a $90,000 asset.
BTC moves 0.2% in the time it takes to place the order. It moves 0.2% on a quiet Sunday. The spread alone on some exchanges exceeds 0.2%. At 500×, the position does not require a market event to be liquidated. It requires the market to exist.
What this is
This is not a trading tool offered to retail. This is a mechanism for transferring retail capital to the exchange in the shortest possible time, dressed in the language of opportunity. The formula does not lie. The marketing does.
The corridor shrinks as leverage increases — Formula 01 in one line
33.3%
corridor
10×
10.0%
corridor
50×
2.0%
corridor
100×
1.0%
corridor
200×
0.5%
corridor
500×
0.2%
corridor
Every figure above is Formula 01: 1 ÷ leverage. No other calculation required. The corridor at 500× is narrower than the typical bid-ask spread on a volatile asset. The position has no viable room to exist.

A lever multiplies a small push.
So does this. In both directions.

The word is not a metaphor. It is a description of the mechanics. Move the fulcrum. As leverage rises, the pivot slides toward the load — and a smaller push on your side swings the price further. The same geometry that lets a small input lift a large position also lets a small move against you drop it onto the liquidation floor. Watch where the floor sits.
FULCRUM YOUR PUSH THE MARGIN THE POSITION THE PRICE SMALL PUSH 33.3% LIQUIDATION FLOOR — RISES WITH LEVERAGE
Leverage — drag to move the fulcrum
25×50×75×100×
The Push That Ends It
33.3%
1 ÷ leverage
Your Margin On $90k
$30,000
notional ÷ leverage
$ Move To Liquidation
$30,000
on a $90,000 entry
1 ÷ 3 = 33.3% — the push that lifts the position is the push that drops it
At 3× the fulcrum sits near the middle. Effort and load are close to balanced. The floor is far from the load.

Your parameters.
Your liquidation price.

Adjust entry price and leverage. See the corridor update in real time. This tool illustrates the mechanical relationship between leverage, margin, and liquidation price. It is not a trading platform, does not represent live market data, and does not account for exchange-specific maintenance margin requirements, funding rates, or fees.
Leverage Position Calculator
Entry Price $90,000
$10k$200k
Leverage
100×
Price Move +0%
−60%+60%
Notional Position $90,000
Margin Required $30,000
Move to Liquidation −33.3%  /  −$30,000
———— Scenario ————
Current Price $90,000
P&L $0
Return on Margin 0.0%
Price corridor — live position view
$60k LIQ
$90k ENTRY
NOW
$120k +100%
Status: Position open. At the current parameters, the position is viable. Move the price slider to model scenarios. Note that exchange maintenance margin requirements, funding costs, and fees are not modelled here — real-world liquidation prices will be slightly closer to entry than shown.
Regulatory & Risk Disclosure

This page is for educational and informational purposes only. It does not constitute financial advice, a personal recommendation, or an inducement to enter into any transaction. Nothing on this page should be relied upon as the basis for any trading or investment decision.

Paul Faulkner and The Rogue Protocol do not hold Financial Conduct Authority (FCA) authorisation and do not provide regulated investment advice, portfolio management services, or any regulated financial service. The worked examples and interactive tools on this page are illustrative mathematical tools only. They do not represent live market data, exchange-specific conditions, or personalised advice of any kind.

Leveraged trading carries a high level of risk and may not be suitable for all investors. You may lose some or all of your initial capital. In certain market conditions and with certain products, losses can exceed your initial deposit. Retail traders in the UK accessing leveraged crypto derivatives should be aware that FCA regulations restrict the marketing and distribution of certain leveraged crypto products to retail consumers. You should satisfy yourself as to whether any leveraged product is appropriate for your circumstances before trading.

The mathematics on this page use simplified, illustrative formulae. Real-world liquidation prices are determined by exchange-specific maintenance margin requirements, mark price calculations, funding rates, and trading fees — all of which will reduce the margins shown in the worked example. The figures above represent mechanical relationships, not executable trading conditions.

Before You Trade
Seek independent financial advice from an FCA-authorised adviser. Understand the specific terms, fees, and liquidation mechanics of any exchange or platform you use. Never trade capital you cannot afford to lose. Past performance is not a reliable indicator of future results.
The Purpose of This Page
Mathematical literacy is not the same as a recommendation to trade. This page exists because leverage is routinely lectured about by people who cannot write the liquidation formula. Understanding the arithmetic is prerequisite to any informed opinion — for or against leveraged exposure.